

Google Chrome has a lot of hidden features. Most of these features are not meant for normal features. In the Chrome browser, you can access some special tools called Developer Tools (aka DevTools) which allow users to test and debug the user interface of their web pages. There are different ways to open and access the Developer Tools on the Chrome browser.
How to Open Chrome Developer Tools [Shortcut]
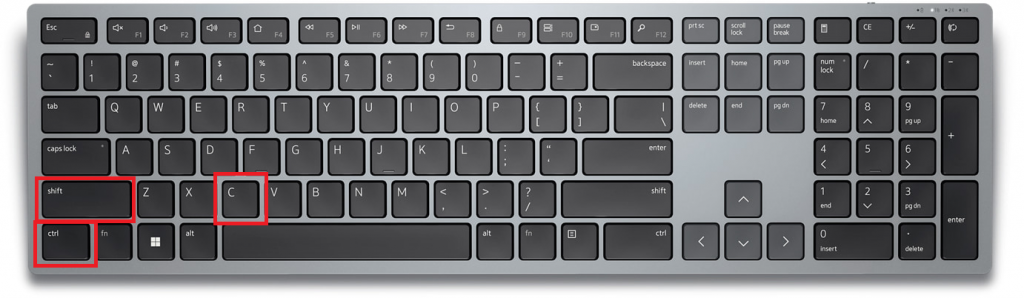
Using the keyboard shortcuts is the easiest way to access the developer tools on Chrome. You can use the Windows shortcut key Ctrl + Shift + C to open the Chrome Developer Tools. For Mac, press the Command + Shift + C keys. This will open the Elements section of the Developer menu. You can also press the F12 or Fn + F12 key to open the Console section of the Developer menu.
Alternate Way
1. Open the Chrome browser on your device and go to the website that you want to access.
Information Use !!
Concerned about online trackers and introducers tracing your internet activity? Or do you face geo-restrictions while streaming? Get NordVPN - the ultra-fast VPN trusted by millions, which is available at 69% off + 3 Months Extra. With the Double VPN, Split tunneling, and Custom DNS, you can experience internet freedom anytime, anywhere.

2. Now, right-click on the page and select Inspect option.
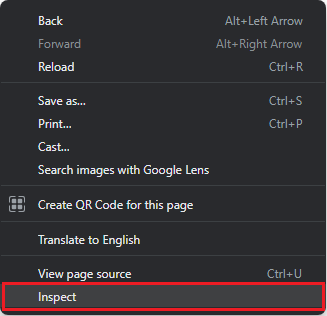
3. The Developer Tools will open on the right side of your webpage.
4. Make the necessary changes and fine-tune your website.
5. Using the Developer tools, you can also hack the Dinosaur game.
How to Open Console Developer Tools
1. Open the Chrome Browser on your device.
2. Now click on the three vertical dots at the right-side corner near the profile icon.
3. From the list of options, highlight the More tools option.
4. Now, select Developer Tools.
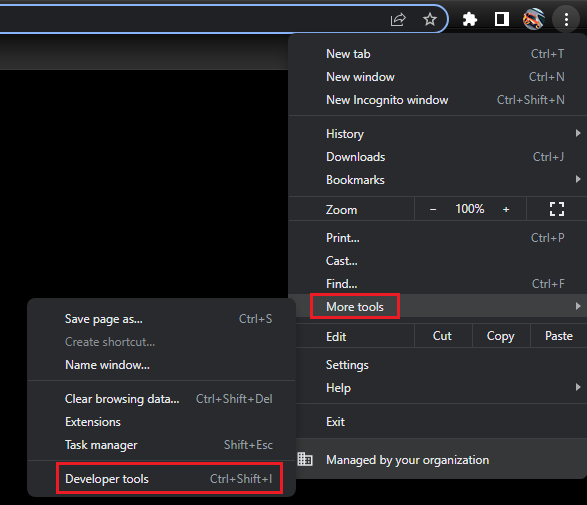
5. The Developer Tools will now appear on the right side of the tab. You can also use the shortcut keys Ctrl + Shift + I to open the Console Developer Tools.
How to Customize Developer Window
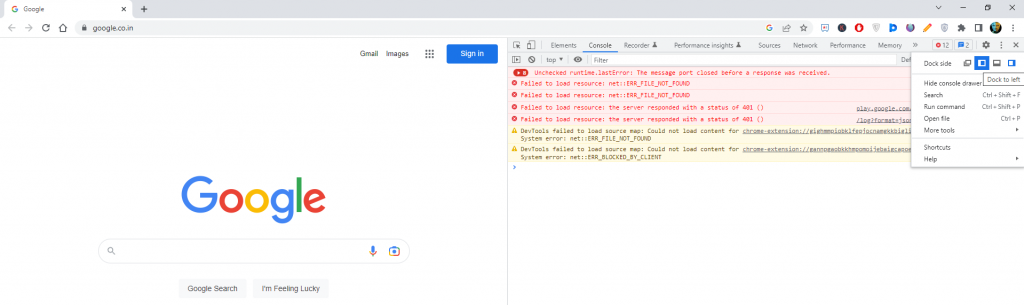
By default, the Developer Window will appear on the left side of the webpage. If you want, you can change the position. To do so,
1. Click the Customize and Control DevTools icon.
2. In the Dock Side menu, you will get four options.
3. Click the first option to open the Chrome Developer Tools in a new window.
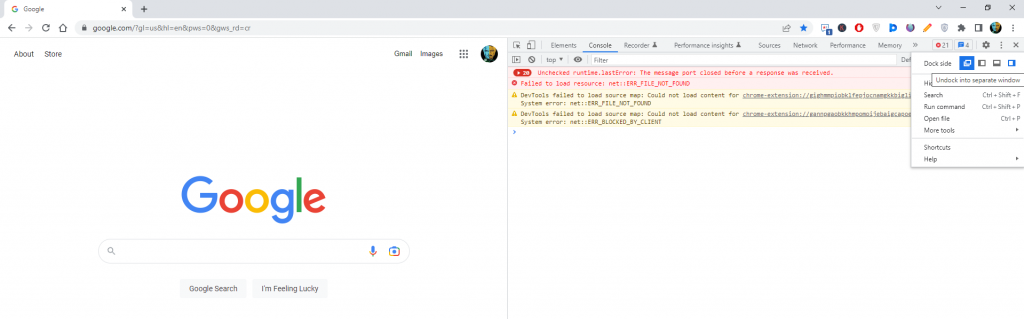
4. Choose your preferred option to change the Dev menu.
How to Auto-Open DevTools on Every New Tab
1. Close all the Chrome tabs on your device. Don’t worry, you can restore the closed tabs on Chrome without any loss in progress.
Note: To get the best results, make sure there is nothing related to Chrome running in the background.
2. Open the Terminal (on Mac) or Command Prompt (on Windows or Linux).
3. Depending on the operating system you use, run the following command:
- macOS
- open -a “Google Chrome” –args –auto-open-devtools-for-tabs
- Windows
- start chrome –auto-open-devtools-for-tabs
- Linux
- google-chrome –auto-open-devtools-for-tabs
The Developer Tools will automatically open on every new tab you open.
How to Close the Developer Tools on Chrome
If you are done with your testing, you can just press the Close icon on the Developer menu to close the window. You will get the normal webpage. You can also use the same shortcut key to close the window.
Frequently Asked Questions
In Selenium Python or any Chromium-based browser, you can use the shortcut key Ctrl + Shift + C to open the Developer Tools.
Disclosure: If we like a product or service, we might refer them to our readers via an affiliate link, which means we may receive a referral commission from the sale if you buy the product that we recommended, read more about that in our affiliate disclosure.